Originally published on LinkedIn, December 2024. Adapted for the XWARE Insights.
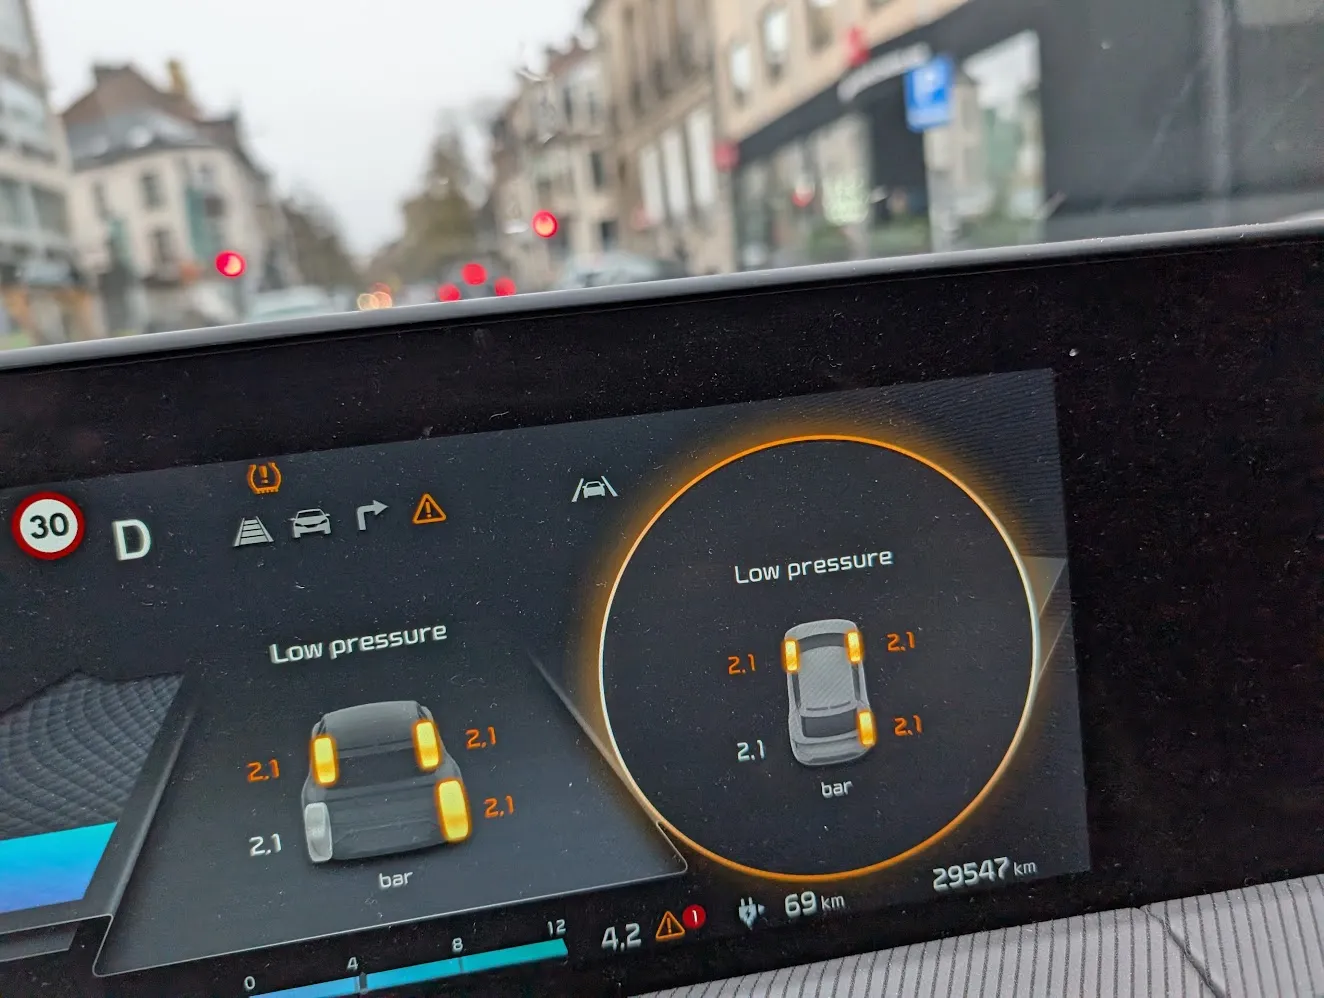
When I first posted that photo of my dashboard showing the tire pressure monitoring system (TPMS) warning, with four tires all solidly reading 2.1 bar, yet three flashing Low Pressure — I expected a few knowing smiles and maybe a reminder that "cold air shrinks."
Instead, the comments went into full conference mode.
Engineers from chassis, HMI, embedded software, and test backgrounds along with everyday drivers all joined in. Some offered perfectly valid thermodynamics explanations. Others suggested replacing TPMS batteries, recalibrating the system, inflating with nitrogen, switching brands, or simply moving somewhere warmer. A few threads even drifted into UX philosophy and organizational silos in automotive R&D.
Then there was something I did not expect at all: the post was selected as one of Best of LinkedIn CW 47/48: Next-Gen Vehicle Intelligence featuring 60 handpicked posts and 29 new people worth following.
At that point, improvising in the comments felt a bit insufficient. So this is the promised follow-up, not insider information, but a systems engineer's reconstruction of what is likely happening, based on first principles, typical TPMS architectures, and experience integrating systems where physics, software, and regulation collide.
The discussion itself was revealing. Some zeroed in on thermodynamics. Others correctly identified rounding and threshold issues. A few suspected dying TPMS batteries. One person asked where the OFF button is (I sympathize). Another suggested kicking the three flagged tires as a form of field validation. And yes, someone commented that it "looks like implemented by AI."
What struck me is that almost everyone was describing a valid slice of the system, just from different layers: sensor physics, ECU logic, network timing, HMI design, test coverage, even organizational boundaries. That's exactly why this small dashboard icon makes such a good case study for understanding software-defined vehicles everyone is talking about today.
The visible paradox
The situation itself was simple: four tires, all showing 2.1 bar, with three highlighted as Low Pressure.
On the surface, this feels contradictory. Underneath, it is a very modern systems story, especially on recent EV platforms where TPMS data travels from in-wheel sensors over RF into a body or domain controller, across vehicle networks, and finally into a digital instrument cluster.
Physics: the easy part
Pressure does drop when temperature drops. For an ideal gas in a fixed volume, pressure is proportional to temperature. Cooling from roughly 20 °C to 0 °C can easily reduce tire pressure by 0.1–0.2 bar, depending on the starting point.
If the recommended cold pressure is around 2.5 bar (approximately 36 psi or 250 kPa typical for a medium-sized vehicle, depending on tire specification), then a cold-morning reading around 2.1–2.2 bar is not particularly surprising.
So yes, "thermodynamics" is part of the explanation, but it's not the interesting part.
The real question is this: Why does the system show the same value everywhere, while behaving as if the wheels were different? That question does not live in physics alone. It lives at the intersection of physics, regulation, software logic, and human perception.
Regulation: the elephant in the room
TPMS behavior is heavily shaped by regulation. Car manufacturers and suppliers don't start with a blank sheet; they start with requirements such as UNECE Regulation No. 64 in Europe and FMVSS No. 138 in the United States.
These frameworks broadly require the vehicle to warn the driver when tire pressure drops significantly below the recommended cold inflation pressure — typically around 20–25% under recommendation, with absolute minimum limits (for example, around 150 kPa or 1.5 bar in many UNECE scenarios).
They also define reaction timing. FMVSS 138 expects detection within about 20 minutes of driving once thresholds are crossed. UNECE procedures allow longer cumulative driving times in certain test cases.
In other words, the TPMS is not being dramatic on a cold morning. It is fulfilling a legal duty related to safety and energy consumption.
What's funny is that regulation does not require the opposite: there is no symmetric obligation to warn when tires drift above the recommended pressure.
So if you inflate your tires correctly at 0 °C and forget about them in April, they may end up several tenths of a bar over target on a warm afternoon — and the system will quietly accept it. That asymmetry is baked into regulatory and design assumptions and is a major source of seasonal confusion for drivers.
How the TPMS is probably built
While implementation details vary between OEMs, modern vehicles typically use direct TPMS (which means based on real pressure sensor measurement, not estimation).
Each wheel contains a module combining a piezo MEMS pressure sensor, a temperature sensor, an accelerometer, a small microcontroller, and a low-power RF transmitter (commonly around 433 MHz).
Those in-wheel modules measure absolute pressure in kilopascals, along with temperature and motion data. They transmit packets periodically or when certain conditions change. A TPMS or body controller receives the data, validates it, applies filtering, computes warning states, and publishes both numeric pressure values and status flags onto the vehicle network for the cluster to display.
The key point is this: the sensors themselves do not think in "2.1 bar."
Internally, pressure is resolved to around 1 kPa (0.01 bar) or better, with accuracy on the order of ±1% of full scale. So inside the ECU, your four wheels may very well sit at something like 2.17, 2.14, 2.08, and 2.06 bar.
After rounding to one decimal place for display, they all become 2.1 bar. From the system's perspective, they are clearly not equal.
Where software quietly changes the story
Most TPMS implementations do not operate on a single pressure value per wheel.
There is usually a fast path, used for safety and regulatory decisions. It applies minimal filtering and is designed to detect threshold crossings within the timing constraints defined by regulation.
There is also a slow path, feeding the human-machine interface. This path deliberately smooths the data so that values don't jump as you drive, corner, or hit bumps.
On top of that comes hysteresis. A tire typically needs to remain below a threshold for a certain time or distance before a warning is latched. Once the warning is active, the pressure must rise above a higher "clear" threshold — again for a defined duration — before the warning disappears.
This is all intentional. It prevents warning lights from flapping, but also means internal decisions and display timing don't always align.
So you can end up exactly where that dashboard photo landed:
- Internally, the ECU decides that three tires hovering around 2.06–2.10 bar have crossed an under-inflation threshold relative to a 2.5 bar recommendation.
- Externally, the cluster still shows four identical, rounded 2.1 bar values, smoothed over a slightly longer time window.
Both views are consistent; they just live on different abstractions and time scales.
Why winter exposes everything
For most of the year, all four tires sit comfortably away from regulatory limits. Small tolerances, timing offsets, and rounding artifacts remain invisible.
A sudden cold morning changes that. The temperature drop pulls all pressures down together, compressing margins and amplifying otherwise insignificant differences in calibration, sampling time, and filtering behavior.
In practice, winter acts as an uninvited system integration test. It stresses physics, triggers regulatory logic, and exposes mismatches between internal decisions and what the driver sees. It is also remarkably good at finding corner cases and remarkably bad at explaining them.
So… is this a bug?
From a systems-engineering standpoint, no — with an important caveat.
Physics behaves correctly. Sensors operate within specification. Software applies filtering, thresholds, and hysteresis as designed and required.
What breaks down is the story told to the driver.
The UI compresses a multi-dimensional internal state (pressures, trends, thresholds, timing) into a single rounded number and a warning icon. That abstraction works almost all the time. Until it doesn't.
And when the driver sees "2.1 bar everywhere," the natural conclusion is that the system is inconsistent, rather than that the system and the UI are looking at the same reality through two different lenses.
The SDV lesson hiding behind a tire icon
This small TPMS puzzle is a neat proxy for a much larger pattern in software-defined vehicles.
More software does not mean less system. If anything, it means the integration problem becomes harder.
Software now sits directly between physics and people. It encodes regulatory intent, safety margins, and assumptions about human interpretation, then compresses all of that into a few symbols readable at highway speed.
When those assumptions don't align with user perception, even a simple feature can feel wrong — not because the system failed, but because the abstraction leaked.
The same pattern appears in energy management, regenerative braking, ADAS fusion, and drive-mode logic. The vehicle behaves according to requirements, but the way that behavior is presented can still undermine trust.
Final thought
So the next time someone explains your TPMS warning with a confident "root cause" — they're not wrong, but they're only describing the first layer.
What you're really seeing is a modern automotive system doing exactly what it was designed to do, while quietly revealing how difficult it is to reconcile precision, regulation, safety margins, timing, and human expectation on a single dashboard screen.
And if nothing else, it's a good reminder that winter remains one of the most effective validation environments we have — even in the age of software-defined vehicles and over-the-air updates.
This is the kind of systems integration work we navigate daily at XWARE — across embedded, systems, and SDV programs.
I'm considering a follow-up focused on filtering and estimation architectures — let me know in the comments if that would be useful.
P.S. In the meantime, I swapped the summer tires for winter ones and the problem solved itself. At least until next year.
Need guidance on this topic?
Our engineering teams can help you implement these strategies in your current program.
Contact Our Team